Analyzing question responses #
Our app provides analytics features that allow you to analyze the responses to your question. You can gain insights into user engagement and the distribution of responses.
Follow the steps below to analyze the question responses:
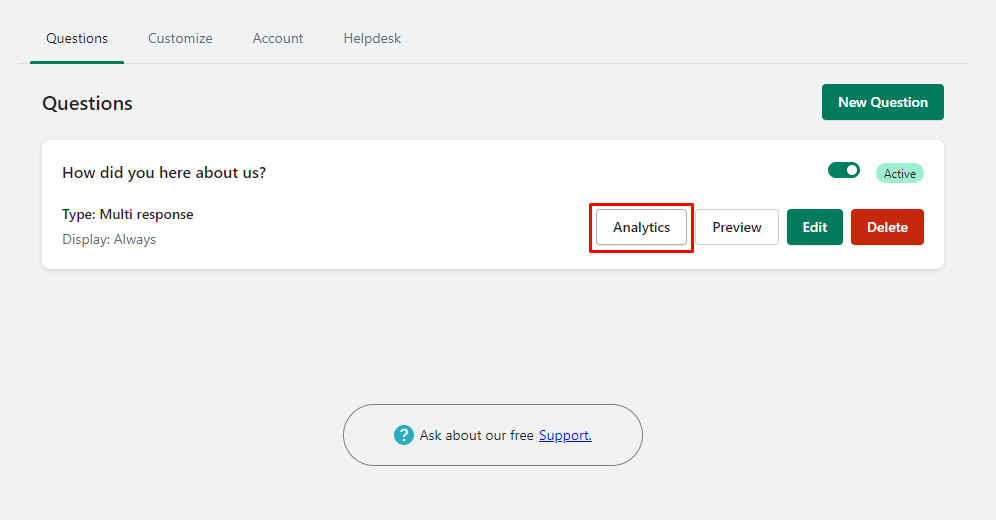
Step 1: From the app admin page, click Questions.
Step 2: Click the Analytics button that you want to analyzing question responses.
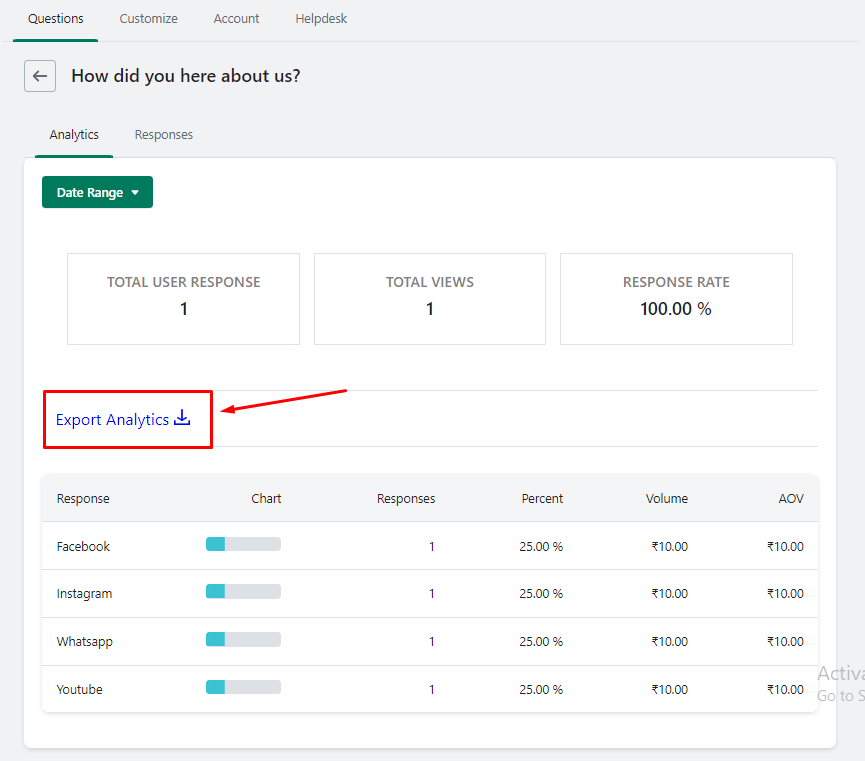
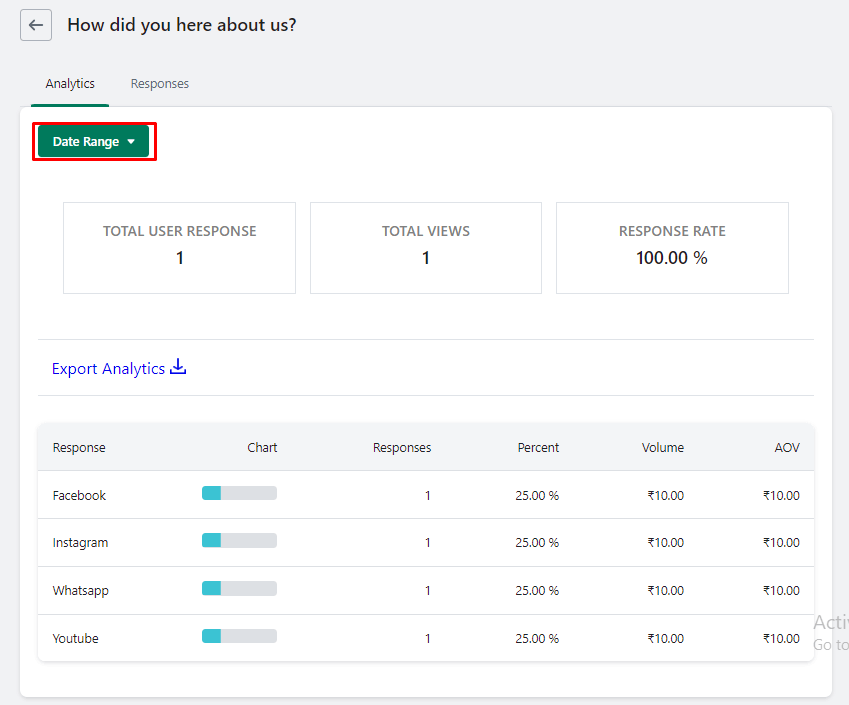
The analytics page will display a summary of the question’s response data, including the following information:
1. Total User Responses:
This represents the total number of users who have responded to the question.
2. Total Views:
This indicates the total number of users who have seen question.
3. Response Rate:
The response rate is calculated as the percentage of users who have responded to the question compared to the total number of views.
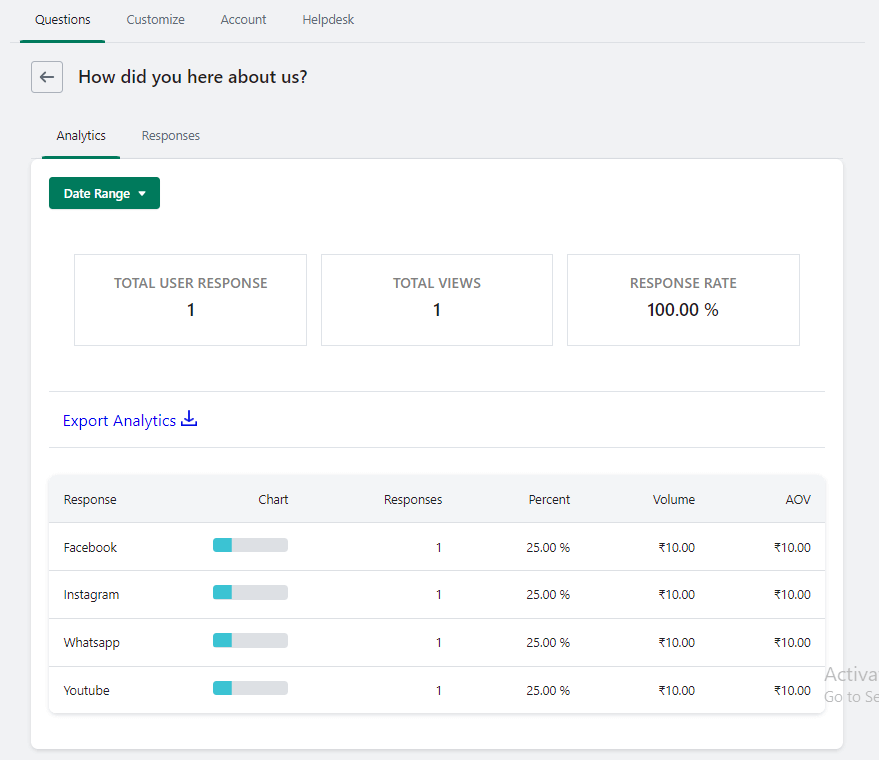
Scroll down to view a table that provides a detailed breakdown of the question responses.
The table shows a list of response options for the question, along with the following information for each option
1. Number of Responses:
This represents the total number of users who selected that specific response option.
2. Percentage of Responses:
This indicates the proportion of users who chose the particular response option, presented as a percentage.
3. Volume of Responses:
This provides a visual representation, such as a bar graph, indicating the relative volume of responses for each option.
By accessing the analytics for your questions, you can gather valuable insights into user feedback and preferences. This information can help you make informed decisions and improve your overall customer experience.
Analyzing Order-Wise Responses #
In addition to analyzing question responses,out app allows you to analyze responses on an order-specific level. This enables you to understand the feedback and preferences associated with each order.
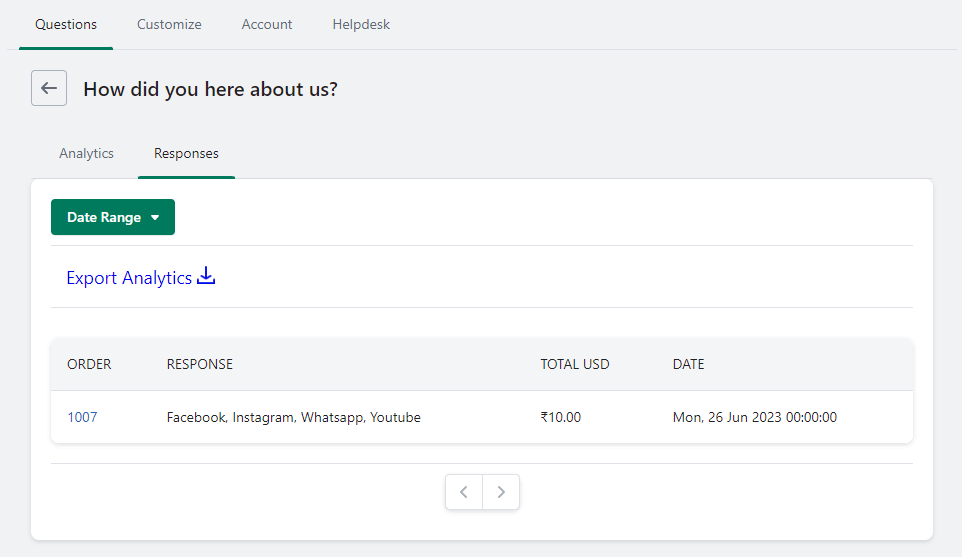
On the analytics page, click on the responses tab that displays the order-wise responses. The table will typically include the following columns:
1. Order :
This column lists the name or identifier of each order that has received responses to the survey question
2. Responses:
This column indicates the total number of responses received for each order
3. Total:
This column provides the cumulative total of amount received across orders.
4. Date:
This column displays the date associated with each order.
By analyzing order-wise responses, you can gain insights into specific customer interactions and preferences associated with each order.
Additional features: #
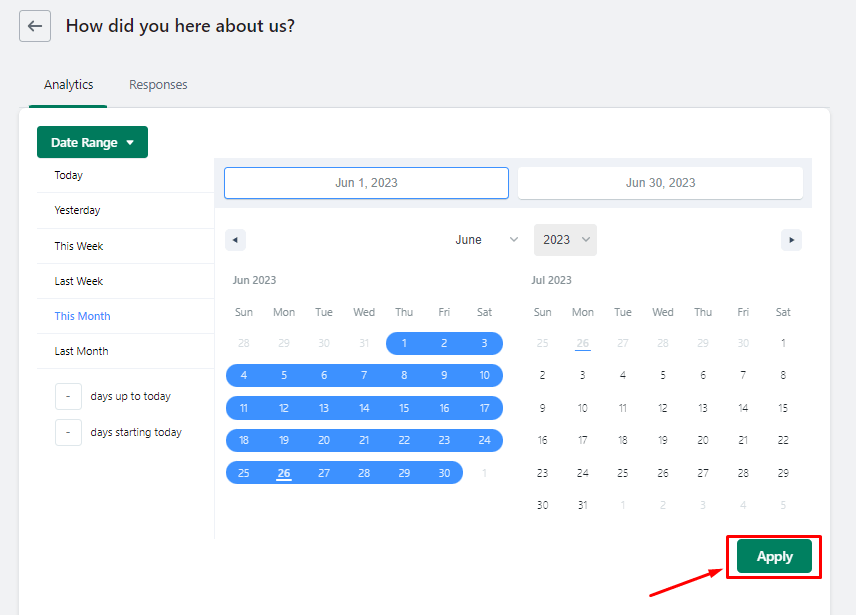
1. Show responses within a particular date range:
Look for a date filter or date range selector on the analytics page.
Select the start date and end date.
2. Export data:
To export the data for further analysis or record-keeping purposes. Typically, you will find an option to export the data in a CSV (Comma-Separated Values) file format. This allows you to download the data and open it in spreadsheet software like Microsoft Excel or Google Sheets.
Click on the export or download button, and the app will generate the CSV file containing the response data. Save the file to your desired location on your computer.